Data studies
Where the Upwork jobs are in 2026: 100,000 jobs by category
Two groups post half of all Upwork jobs and two categories post a quarter. Put volume next to competition and the best markets are not the ones with the most jobs.
Design & Creative and Sales & Marketing posted half of all Upwork jobs.
Upwork jobs posted in 30 days, by top-level group · jobs posted, 4 October to 2 November 2026
Hover or tab through the chart for exact values.
Source: Upsight's job feed: 99,769 Upwork jobs posted 2026-10-04 to 2026-11-02 in the 58 categories with at least 100 jobs measured at 12 hours (100,172 across all 64 categories).Share of the 99,769, top to bottom: 27.4%, 22.6%, 16.6%, 8.9%, 5.3%, 4.8%, 3.6%, 2.6%, 2.2%, 2.1%, 2.1%, 1.7%.
Show the data
| Jobs posted | |
|---|---|
| Design & Creative | 27,348 |
| Sales & Marketing | 22,511 |
| Web, Mobile & Software Dev | 16,519 |
| Admin Support | 8,915 |
| Engineering & Architecture | 5,332 |
| Accounting & Consulting | 4,829 |
| Writing | 3,634 |
| Data Science & Analytics | 2,569 |
| Customer Service | 2,231 |
| Translation | 2,141 |
| IT & Networking | 2,052 |
| Legal | 1,688 |
Between 4 October and 2 November 2026, 100,172 Upwork jobs crossed Upsight's feed. Design & Creative posted 27.4% of them and Sales & Marketing 22.6%, so two of Upwork's twelve groups posted half. Two categories, Digital Marketing (12,565) and Video & Animation (12,466), posted a quarter. Software posted 16.6% of jobs but drew 31.6% of proposals, while Lead Generation posted 7,635 jobs at only 9.2 proposals each.
100,172
Upwork jobs in 30 days
4 Oct to 2 Nov 2026, 64 categories
50%
from two of twelve groups
Design & Creative, Sales & Marketing
25%
from two of 58 categories
Digital Marketing, Video & Animation
0.10
rank correlation
jobs posted vs proposals per job
Half of all Upwork jobs come from two groups
Upwork's demand is concentrated in creative and marketing work. Of the 99,769 jobs posted in the 58 categories we measured, Design & Creative posted 27,348 and Sales & Marketing 22,511: 49,859 jobs, exactly half. Add Web, Mobile & Software Dev (16,519) and three groups hold 66.5% of the market.
The other nine groups share the remaining third. Admin Support posted 8,915 jobs (8.9%), and from there it falls fast: the six smallest groups (Writing, Data Science & Analytics, Customer Service, Translation, IT & Networking and Legal) posted 14,315 jobs between them, 14.3% of the total. Legal, the smallest, posted 1,688 jobs, about 56 a day.
Each job post is counted once, in the category it was filed under. That is where the client put it, which is not always where an agency would file the same work.
Twelve categories post two-thirds of the jobs
Inside the groups, volume piles into a few categories. Digital Marketing posted 12,565 jobs in the month, 12.6% of the total on its own, and Video & Animation posted 12,466. Together that is 25,031 jobs, one in four.
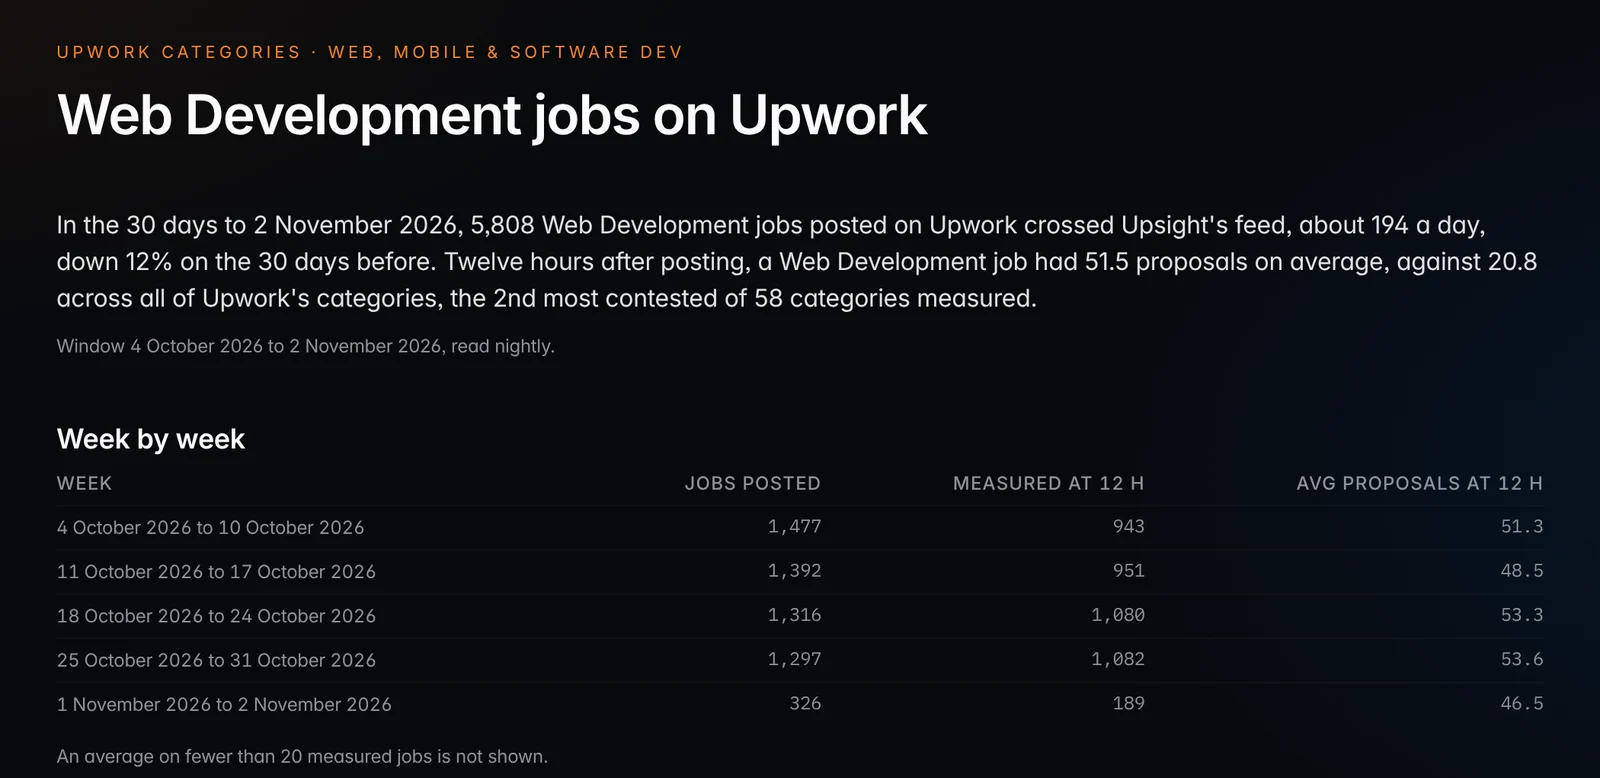
Lead Generation & Telemarketing (7,635) and Graphic, Editorial & Presentation Design (7,227) come next, then Web Development (5,808) and Virtual Assistance (5,137). The twelve busiest categories posted 65,520 jobs, 65.7% of the 99,769. The other 46 categories split the remaining 34,249.
The median category posted about 760 jobs in the month (the midpoint of 730 and 793, the 29th and 30th of 58). That is roughly 25 a day. For most categories, the whole month's demand fits in a list a person could read.
Digital Marketing and Video & Animation each posted more than 12,000 jobs in a month.
The 15 Upwork categories that posted the most jobs · jobs posted, 4 October to 2 November 2026
Hover or tab through the chart for exact values.
Source: Upsight's job feed: 99,769 Upwork jobs posted 2026-10-04 to 2026-11-02 in the 58 categories with at least 100 jobs measured at 12 hours (100,172 across all 64 categories).The 15 shown posted 71,035 jobs, 71.2% of the 99,769.
Show the data
| Jobs posted | |
|---|---|
| Digital Marketing | 12,565 |
| Video & Animation | 12,466 |
| Lead Generation & Telemarketing | 7,635 |
| Graphic, Editorial & Presentation Design | 7,227 |
| Web Development | 5,808 |
| Virtual Assistance | 5,137 |
| Web & Mobile Design | 4,175 |
| Marketing, PR & Brand Strategy | 2,311 |
| Performing Arts | 2,129 |
| Ecommerce Development | 2,077 |
| Accounting & Bookkeeping | 1,997 |
| Customer Service & Tech Support | 1,993 |
| Branding & Logo Design | 1,889 |
| Content Writing | 1,867 |
| Translation & Localization Services | 1,759 |
Software posts one job in six and draws almost a third of the proposals
Where the jobs are and where the proposals go are two different maps. We multiplied each category's measured jobs by its average proposals at 12 hours, summed by group, and compared each group's share of proposals with its share of jobs.
Web, Mobile & Software Dev posted 16.6% of jobs and drew 31.6% of proposals, 1.9 times its share. Data Science & Analytics drew 4.4% of proposals on 2.6% of jobs. Everywhere else the ratio runs the other way: Design & Creative posted 27.4% of jobs and drew 20.5% of proposals, Sales & Marketing 22.6% and 18.1%, and Legal 1.7% and 0.6%.
The arithmetic for one group: the 58 categories drew about 1.65 million proposals at twelve hours (78,938 measured jobs times their category averages). Software's categories drew about 520,000 of them, 31.6%. The averages are rounded to one decimal, so treat these as close, not exact.
Software posts 16.6% of Upwork jobs and draws 31.6% of the proposals.
Each group's share of jobs posted and of proposals at 12 hours · share of the 58 measured categories
Hover or tab through the chart for exact values.
Source: Upsight's job feed, 2026-10-04 to 2026-11-02: jobs posted per category, and proposals per job read about 12 hours after posting on 78,938 of them.Proposals per group = measured jobs times the category average, summed. Averages are rounded to 0.1.
Show the data
| Share of jobs posted | Share of proposals at 12 hours | |
|---|---|---|
| Design & Creative | 27.4% | 20.5% |
| Sales & Marketing | 22.6% | 18.1% |
| Web, Mobile & Software Dev | 16.6% | 31.6% |
| Admin Support | 8.9% | 8.8% |
| Engineering & Architecture | 5.3% | 3.7% |
| Accounting & Consulting | 4.8% | 4.2% |
| Writing | 3.6% | 2.5% |
| Data Science & Analytics | 2.6% | 4.4% |
| Customer Service | 2.2% | 2.1% |
| Translation | 2.1% | 1.2% |
| IT & Networking | 2.1% | 2.2% |
| Legal | 1.7% | 0.6% |
Big and quiet, small and crowded
More jobs does not bring more competition. Ranking the 58 categories by jobs posted and by proposals per job gives a rank correlation of 0.10, close to none. So we split them on both axes at once: above or below the median category (about 760 jobs), and above or below the marketplace average of 20.8 proposals per job.
The result is a map an agency can act on. Big and quiet holds 16 categories and 45.3% of all jobs, every one of them under the average for competition. Small and crowded holds 9 categories and 3.2% of jobs, almost all of them software or data work.
| Quadrant | Categories | Jobs posted | Share of jobs | Examples (jobs, proposals per job) |
|---|---|---|---|---|
| Big and quiet | 16 | 45,217 | 45.3% | Video & Animation (12,466, 13.5); Lead Generation & Telemarketing (7,635, 9.2); Performing Arts (2,129, 6.6); Corporate & Contract Law (1,530, 6.7) |
| Big and crowded | 13 | 42,407 | 42.5% | Digital Marketing (12,565, 21.1); Web Development (5,808, 51.5); Web & Mobile Design (4,175, 40.6); Ecommerce Development (2,077, 34.7) |
| Small and quiet | 20 | 8,956 | 9.0% | Contract Manufacturing (730, 12.4); Electrical & Electronic Engineering (615, 14.5); Photography (575, 6.2); Public Law (158, 8.2) |
| Small and crowded | 9 | 3,189 | 3.2% | AI Apps & Integration (500, 61.6); DevOps & Solution Architecture (620, 32.9); Data Mining & Management (250, 33.6); ERP/CRM Software (247, 28.9) |
Crowded means at or above 20.8 proposals per job at 12 hours. Graphic, Editorial & Presentation Design sits exactly on the line at 20.8 and is counted as crowded.
Two pairs make the point. Lead Generation & Telemarketing posted 1.3 times as many jobs as Web Development (7,635 against 5,808), and a Web Development job drew 5.6 times as many proposals (51.5 against 9.2). Video & Animation and Digital Marketing posted almost the same number of jobs, 12,466 and 12,565, yet a Digital Marketing job drew 21.1 proposals and a video job 13.5.
AI Apps & Integration is the opposite case: the most talked-about work on the platform posted 500 jobs in the month, half of one percent of the market, and each drew 61.6 proposals.
A room index: jobs posted divided by proposals per job
To rank markets on both numbers at once we use one derived figure: jobs posted divided by average proposals per job. Call it the room index.
Here is what it means. If every proposal in a category had the same chance and every job hired one person from its proposals, a proposal sent to every job in the category would expect jobs ÷ proposals-per-job hires. Nobody bids on every job and many jobs never hire, so read the result as a ranking of how much room a category leaves each bidder, not as a forecast of wins.
The arithmetic for five categories:
- Video & Animation: 12,466 ÷ 13.5 = 923
- Lead Generation & Telemarketing: 7,635 ÷ 9.2 = 830
- Digital Marketing: 12,565 ÷ 21.1 = 596
- Web Development: 5,808 ÷ 51.5 = 113
- AI Apps & Integration: 500 ÷ 61.6 = 8.1
Video & Animation has 114 times the room of AI Apps & Integration (923 ÷ 8.1). Performing Arts (2,129 ÷ 6.6 = 323) and Corporate & Contract Law (1,530 ÷ 6.7 = 228) rank fifth and seventh: modest volume, very short lists.
Video & Animation and Lead Generation leave the most room per bidder.
Room index: jobs posted in 30 days divided by average proposals per job at 12 hours, top 15 · jobs posted ÷ proposals per job
Hover or tab through the chart for exact values.
Source: Upsight's job feed, 2026-10-04 to 2026-11-02: jobs posted per category, and proposals per job read about 12 hours after posting on 78,938 of them.A derived ranking, not a forecast of hires. The bottom of the list: Desktop Application Development 5.5, Product Management & Scrum 5.6, AI Apps & Integration 8.1.
Show the data
| Room index | |
|---|---|
| Video & Animation | 923 |
| Lead Generation & Telemarketing | 830 |
| Digital Marketing | 596 |
| Graphic, Editorial & Presentation Design | 348 |
| Performing Arts | 323 |
| Virtual Assistance | 258 |
| Corporate & Contract Law | 228 |
| Marketing, PR & Brand Strategy | 171 |
| Translation & Localization Services | 149 |
| Content Writing | 148 |
| Market Research & Product Reviews | 142 |
| Web Development | 113 |
| Recruiting & Human Resources | 105 |
| Web & Mobile Design | 103 |
| Art & Illustration | 102 |
One trend we can state, and why we stop there
This study is one 30-day window. The only change against the month before that we can state is from Upsight's own category page: Web Development's job count fell 12% against the previous 30 days. We do not have the matching comparison for the other 57 categories in this dataset, so we make no trend claim for them, including the AI categories.
That matters for planning. A category's share of jobs can move from one month to the next. Check the current month on the Upwork categories page, which refreshes nightly, before you commit a quarter's Connects to a market on the strength of one month.
What to do with this
- 1
List every category your work can honestly sit in
A Shopify team fits Web Development (room index 113), Ecommerce Development (2,077 ÷ 34.7 = 60) and QA Testing (907 ÷ 23.5 = 39). A video team fits Video & Animation (923) and often Marketing, PR & Brand Strategy (2,311 ÷ 13.5 = 171). Compute the index for each.
- 2
Track each one with a saved search
Upwork's help center says you can keep up to 30 saved searches to track jobs across categories. One saved search per category and core keyword turns this table into a daily habit.
- 3
Spend Connects where the room is
Every proposal costs Connects whether or not it is read (what a proposal costs). In a big and quiet category, a proposal is one of roughly 7 to 14 at twelve hours. In a small and crowded one, decide early whether a boost is worth it (is boosting worth it).
- 4
In crowded categories, arrive early or arrive late on purpose
The twelve-hour count is a running total. Be among the first proposals, or use late bidding on the jobs the crowd skipped. Per-category competition is in how many proposals an Upwork job gets.
“You can save up to 30 searches to easily track jobs across different categories.”
Upsight's campaigns sweep the job feed every 15 minutes and score each job against criteria the agency writes, so a campaign aimed at a big and quiet category reaches the short list while it is still short. The category pages are free and need no account.
The full table, and how we measured it
All 58 categories
| Category | Group | Jobs posted | Share of jobs | Avg proposals at 12 h | Room index |
|---|---|---|---|---|---|
| Digital Marketing | Sales & Marketing | 12,565 | 12.6% | 21.1 | 595.5 |
| Video & Animation | Design & Creative | 12,466 | 12.5% | 13.5 | 923.4 |
| Lead Generation & Telemarketing | Sales & Marketing | 7,635 | 7.7% | 9.2 | 829.9 |
| Graphic, Editorial & Presentation Design | Design & Creative | 7,227 | 7.2% | 20.8 | 347.5 |
| Web Development | Web, Mobile & Software Dev | 5,808 | 5.8% | 51.5 | 112.8 |
| Virtual Assistance | Admin Support | 5,137 | 5.1% | 19.9 | 258.1 |
| Web & Mobile Design | Web, Mobile & Software Dev | 4,175 | 4.2% | 40.6 | 102.8 |
| Marketing, PR & Brand Strategy | Sales & Marketing | 2,311 | 2.3% | 13.5 | 171.2 |
| Performing Arts | Design & Creative | 2,129 | 2.1% | 6.6 | 322.6 |
| Ecommerce Development | Web, Mobile & Software Dev | 2,077 | 2.1% | 34.7 | 59.9 |
| Accounting & Bookkeeping | Accounting & Consulting | 1,997 | 2.0% | 24.0 | 83.2 |
| Customer Service & Tech Support | Customer Service | 1,993 | 2.0% | 20.1 | 99.2 |
| Branding & Logo Design | Design & Creative | 1,889 | 1.9% | 25.3 | 74.7 |
| Content Writing | Writing | 1,867 | 1.9% | 12.6 | 148.2 |
| Translation & Localization Services | Translation | 1,759 | 1.8% | 11.8 | 149.1 |
| Art & Illustration | Design & Creative | 1,614 | 1.6% | 15.8 | 102.2 |
| Market Research & Product Reviews | Admin Support | 1,550 | 1.6% | 10.9 | 142.2 |
| Corporate & Contract Law | Legal | 1,530 | 1.5% | 6.7 | 228.4 |
| 3D Modeling & CAD | Engineering & Architecture | 1,525 | 1.5% | 17.9 | 85.2 |
| Mobile Development | Web, Mobile & Software Dev | 1,405 | 1.4% | 40.1 | 35 |
| Data Entry & Transcription Services | Admin Support | 1,339 | 1.3% | 34.7 | 38.6 |
| AI & Machine Learning | Data Science & Analytics | 1,267 | 1.3% | 41.5 | 30.5 |
| Recruiting & Human Resources | Accounting & Consulting | 1,160 | 1.2% | 11.1 | 104.5 |
| QA Testing | Web, Mobile & Software Dev | 907 | 0.9% | 23.5 | 38.6 |
| Project Management | Admin Support | 889 | 0.9% | 22.1 | 40.2 |
| Editing & Proofreading Services | Writing | 875 | 0.9% | 16.7 | 52.4 |
| Product Design | Design & Creative | 873 | 0.9% | 13.0 | 67.2 |
| Scripts & Utilities | Web, Mobile & Software Dev | 862 | 0.9% | 39.4 | 21.9 |
| Civil & Structural Engineering | Engineering & Architecture | 793 | 0.8% | 10.7 | 74.1 |
| Contract Manufacturing | Engineering & Architecture | 730 | 0.7% | 12.4 | 58.9 |
| Data Analysis & Testing | Data Science & Analytics | 678 | 0.7% | 32.2 | 21.1 |
| Network & System Administration | IT & Networking | 662 | 0.7% | 19.9 | 33.3 |
| Building & Landscape Architecture | Engineering & Architecture | 636 | 0.6% | 16.1 | 39.5 |
| DevOps & Solution Architecture | IT & Networking | 620 | 0.6% | 32.9 | 18.8 |
| Electrical & Electronic Engineering | Engineering & Architecture | 615 | 0.6% | 14.5 | 42.4 |
| Audio & Music Production | Design & Creative | 575 | 0.6% | 14.2 | 40.5 |
| Photography | Design & Creative | 575 | 0.6% | 6.2 | 92.7 |
| Professional & Business Writing | Writing | 550 | 0.6% | 13.8 | 39.9 |
| Management Consulting & Analysis | Accounting & Consulting | 525 | 0.5% | 16.2 | 32.4 |
| Information Security & Compliance | IT & Networking | 523 | 0.5% | 15.8 | 33.1 |
| AI Apps & Integration | Web, Mobile & Software Dev | 500 | 0.5% | 61.6 | 8.1 |
| Financial Planning | Accounting & Consulting | 491 | 0.5% | 18.3 | 26.8 |
| Other - Accounting & Consulting | Accounting & Consulting | 481 | 0.5% | 11.5 | 41.8 |
| Energy & Mechanical Engineering | Engineering & Architecture | 461 | 0.5% | 10.5 | 43.9 |
| Language Tutoring & Interpretation | Translation | 382 | 0.4% | 8.5 | 44.9 |
| Data Extraction/ETL | Data Science & Analytics | 374 | 0.4% | 28.4 | 13.2 |
| Interior & Trade Show Design | Engineering & Architecture | 349 | 0.3% | 18.5 | 18.9 |
| Sales & Marketing Copywriting | Writing | 342 | 0.3% | 17.1 | 20 |
| Game Design & Development | Web, Mobile & Software Dev | 265 | 0.3% | 16.9 | 15.7 |
| Data Mining & Management | Data Science & Analytics | 250 | 0.3% | 33.6 | 7.4 |
| ERP/CRM Software | IT & Networking | 247 | 0.2% | 28.9 | 8.5 |
| Other - Software Development | Web, Mobile & Software Dev | 242 | 0.2% | 20.8 | 11.6 |
| Community Management & Tagging | Customer Service | 238 | 0.2% | 11.6 | 20.5 |
| Physical Sciences | Engineering & Architecture | 223 | 0.2% | 9.9 | 22.5 |
| Personal & Professional Coaching | Accounting & Consulting | 175 | 0.2% | 11.4 | 15.4 |
| Public Law | Legal | 158 | 0.2% | 8.2 | 19.3 |
| Product Management & Scrum | Web, Mobile & Software Dev | 149 | 0.1% | 26.6 | 5.6 |
| Desktop Application Development | Web, Mobile & Software Dev | 129 | 0.1% | 23.4 | 5.5 |
Room index = jobs posted ÷ average proposals per job at 12 hours. Six categories with fewer than 100 measured jobs (403 jobs in all) are left out.
Questions
Which Upwork category has the most jobs in 2026?
Digital Marketing, with 12,565 jobs posted between 4 October and 2 November 2026, followed closely by Video & Animation with 12,466. Together they posted 25.1% of the 99,769 jobs in the 58 categories Upsight measured.
What kind of work is most in demand on Upwork?
By volume, creative and marketing work. Design & Creative posted 27.4% of jobs in October 2026 and Sales & Marketing 22.6%, half the market between them. Web, Mobile & Software Dev came third with 16.6%, and Legal was smallest at 1.7%.
Which Upwork categories have many jobs and little competition?
Lead Generation & Telemarketing posted 7,635 jobs at 9.2 proposals each, Video & Animation 12,466 at 13.5, Performing Arts 2,129 at 6.6 and Corporate & Contract Law 1,530 at 6.7. The marketplace average was 20.8 proposals per job at twelve hours.
Is Upwork saturated for web developers?
It is crowded. Web Development posted 5,808 jobs in the month to 2 November 2026, and each drew 51.5 proposals at twelve hours, two and a half times the 20.8 average. Its job count also fell 12% against the previous 30 days.
How many jobs are posted on Upwork per month?
Upsight's feed counted 100,172 jobs posted between 4 October and 2 November 2026, about 3,300 a day, across 64 categories. The count covers the public posts in Upsight's feed, not invite-only jobs.
Orhan G. Yalçın
Founder of Upsight and of Vizio AI, an Upwork agency that bids with Upsight every day. Every number on this blog comes with its sample, window and method. More about how we measure.
Terms in this post: Proposals at 12 hours · Search volume · Keyword difficulty · Job post · Late bidding · Boosted proposal
Read next
Data studies
How many proposals does an Upwork job get? We measured 79,245 jobs
Twelve hours after posting, the average Upwork job has 20.8 proposals. In AI integration work it has 61.6; in photography, 6.2. Where you bid decides how crowded the room is.
Data studies
How many Connects does an Upwork proposal cost? 1,040 sends measured
Upwork prices every job separately and publishes no range. Across 1,040 proposals the median asked 15 Connects, $2.25, and nothing asked more than 27.
Data studies
Is boosting an Upwork proposal worth it? What 9,788 proposals show
Boosted proposals were viewed twice as often and answered 2.5 times as often. They cost more Connects each, and fewer per reply once refunds are counted.